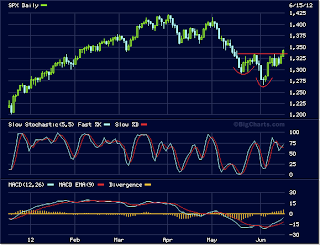
After the buy signal 3 weeks ago, the target area 1 375 - 1 400 for S&P 500 has now been reached. At this point, there's reason to be cautious. As illustrated on the chart below, a rising wedge could be in the making, and if this pattern breaks to the downside, things could get pretty nasty. S&P 500 needs to hold the rising trendline, currently at around 1 340, which also corresponds to the 50-day moving average. I'm bull above 1 340 and bear below 1 340.
fredag 6 juli 2012
S&P 500 - target reached, now what?
torsdag 5 juli 2012
EUR/USD - in bear territory
The euro got hammered today. In yesterday's post, I was leaning to the bull side, but wrote that a break above 1,26 or below 1,25 would lead to the next big move. 1,25 was broken hard today and so far we've reached as low as 1,2360
EUR/USD is just bearish. Next important level to watch is 1,23, the price low from early June.
onsdag 4 juli 2012
EUR/USD
For stocks to continue rising, it's crucial that the euro also moves higher. Looking at the EUR/USD monthly chart, you can see that we have reached important levels. Positive momentum divergence is a positive sign.
Daily chart. After Friday's big move, there's been a pullback this week and today we reached 1,25. This could be the low for this pullback. It we continue below 1,25, we'll switch back to the risk-off mode again, with lower stock prices as a consequence. I'm leaning to that this is a bull flag pattern that will resolve to the upside. The daily candlestick also has a bullish tail. We'll see. Look for a break above 1,26 or below 1,25 for the next big move.
Zooming in on the hourly chart, it shows that a break above 1,26 would signal that the next upleg is underway.
tisdag 3 juli 2012
Time for a short pause
Bullish action continues as expected, but now it's time for a pause, here illustrated by Germany's DAX index, which reached resistance at 6 560 today, and it's also extremely overbought. Look for a minor pullback.
fredag 29 juni 2012
Bulls on the run
Previous post disappeared, but I mentioned key support levels for Euro Stoxx 50 (2 100) and S&P 500 (1 300). These levels were tested yesterday and they hold. Today bulls took over, illustrated below by the clear break of resistance (2 200) for Euro Stoxx 50. This is strong price action from an obvious bottom formation, with positive momentum divergence etc.
Today's action indicates that prices will move higher in the short term.
Today's action indicates that prices will move higher in the short term.
Etiketter:
Day Trading,
Euro Stoxx 50,
SPX,
Technical Analysis
torsdag 21 juni 2012
Euro Stoxx 50 - buy signal
Previuos post:
"Euro Stoxx 50 is still building on the right shoulder of a potential inverted head and shoulders pattern. After hitting resistance at 2 200 today, price reversed. If 2 200 is cleared, next move would be to the 2 350 area." The right shoulder was completed and we now have a buy signal in place after clearing 2 200:
"Euro Stoxx 50 is still building on the right shoulder of a potential inverted head and shoulders pattern. After hitting resistance at 2 200 today, price reversed. If 2 200 is cleared, next move would be to the 2 350 area." The right shoulder was completed and we now have a buy signal in place after clearing 2 200:
Etiketter:
Daytrading,
Euro Stoxx 50,
Technical Analysis
måndag 18 juni 2012
Euro Stoxx 50 - update
Euro Stoxx 50 is still building on the right shoulder of a potential inverted head and shoulders pattern. After hitting resistance at 2 200 today, price reversed. If 2 200 is cleared, next move would be to the 2 350 area.
Etiketter:
Day Trading,
Euro Stoxx 50,
Technical Analysis
söndag 17 juni 2012
S&P 500 – buy signal
S&P 500 has broken out of an inverted head and shoulders pattern and given a buy signal. Price target is the 1 375 – 1 400 area.
måndag 11 juni 2012
Euro Stoxx 50 - to 2 100, then continued move to the upside?
Euro Stoxx 50 seems to be forming an inverted head and shoulders pattern, with the right shoulder currently underway, targeting the 2 100 area. Next move would be to the 2 350 area, if 2 200 is cleared.
Etiketter:
Day Trading,
Euro Stoxx 50,
Technical Analysis
SPX - to 1 300-1 310, then continued move to the upside?
S&P 500 seems to be forming an inverted head and shoulders pattern, with the right shoulder currently underway, targeting the 1 300 - 1 310 area. Next move would be to the 1 375 - 1 400 area.
onsdag 25 april 2012
Det blev 1 005
Det är sannolikt att botten för nedåtrörelsen för OMXS30 enligt förra inlägget sattes vid 1 005 och index nådde alltså inte riktigt 980. Kortsiktigt är jag då härifrån försiktigt positiv.
måndag 23 april 2012
OMXS30 - mot 980
Prenumerera på:
Inlägg (Atom)


