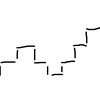
Daily chart. After Friday's big move, there's been a pullback this week and today we reached 1,25. This could be the low for this pullback. It we continue below 1,25, we'll switch back to the risk-off mode again, with lower stock prices as a consequence. I'm leaning to that this is a bull flag pattern that will resolve to the upside. The daily candlestick also has a bullish tail. We'll see. Look for a break above 1,26 or below 1,25 for the next big move.
Zooming in on the hourly chart, it shows that a break above 1,26 would signal that the next upleg is underway.


Inga kommentarer:
Skicka en kommentar